Tuesday, December 18, 2012

Vertical and horizontal lines or strips on Line Chart in SSRS


How do you show a vertical or horizontal line on a line chart in SSRS? After hours or research it seems that approach involving StripLines works the best.
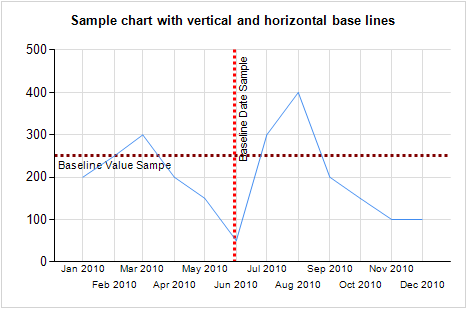
Horizontal or vertical likes can be used on the chart to indicate baselines or highlight particular sections as on the sample below:


So, how do you build a chart like that? Start with the data set.
My sample dataset contains a simple query that returns: month (as date) for X axis, value for Y axis, baseline value for Y axis, baseline value for X axis (date). In order to properly plot the vertical baseline the date used as a baseline value for X axis must be converted to its integer representation. 

Here is the query:

Declare @table Table (id int identity(1,1), event_date datetime, event_value int)

Insert @table 
Select 'Jan 1, 2010', 200
Union Select 'Feb 1, 2010', 250
Union Select 'Mar 1, 2010', 300
Union Select 'Apr 1, 2010', 200
Union Select 'May 1, 2010', 150
Union Select 'Jun 1, 2010', 50
Union Select 'Jul 1, 2010', 300
Union Select 'Aug 1, 2010', 400
Union Select 'Sep 1, 2010', 200
Union Select 'Oct 1, 2010', 150
Union Select 'Nov 1, 2010', 100
Union Select 'Dec 1, 2010', 100

Declare @baseline_value int,
@baseline_date datetime

Set @baseline_value  = 250
Set @baseline_date = 'June 1, 2010'

Select 
event_date,
event_value,
@baseline_value as baseline_value,
@baseline_date as baseline_date,
CAST(@baseline_date as int) as baseline_date_int
From 
@table

The result of the query looks like this:


Create a new report and use above query as a data source. Add new Line Chart object, associate it with the data source. Select “event_value” column to be used for Values and “event_date” column will be used for Category Groups.

Modify Horizontal Axis properties as highlighted below:


Format axis label as "MMM yyyy".

Click on X axis and in the properties window find "StipLines" attribute. Click on "Collection" to open collection editor.

Modify attributes as highlighted below:


IntervalOffset value is set using formula "=CInt(Max(Fields!baseline_date_int.Value))".

Do the same steps for Y axis. IntervalOffset value is set using formula "=CInt(Max(Fields!baseline_value.Value))"

Preview the report and enjoy the result!

You can use the same technique to highlight areas on X or Y axis as below. Click here to download sample "Vertical and Horizontal Lines on line graph.rdl" for more details.


Wednesday, November 14, 2012

Scripting table data


Every now and then I need to create a SQL script to move table data between environments or to simply load table during database deployment process.

For a number of years I am using the stored procedure created by Narayana Vyas Kondreddi (http://vyaskn.tripod.com). This is a great tool for scripting data without any problems!
Attached script creates “sp_generate_inserts” stored procedure in master database (so it is accessable from any database on the server).

The description portion in the script contains the complete description of the parameters and usage examples.

You can get the script here:


This is what the output looks like:


Tuesday, October 16, 2012

Small cell value suppression in SSAS cube output


I am currently working on project building information system for one of the provincial health registries. Patient data protection and privacy is one of the main requirements that touched all parts of the information system including standard reports and SSAS cubes.

One of the requirements I’ve encountered while working with SSAS cubes was that measure values that contain values less than 6 must be suppressed and displayed to the user as “<6” in order to minimize potential patient re-identification.
My first intuition was to implement this using a calculated measure that would inspect the value of the cube measure and overwrite it with “<6” using the following statement:

CREATE MEMBER CURRENTCUBE.[Measures].[# of Something - All Supressed]
AS
iif([Measures].[# of Something - All] > 0 AND [Measures].[# of Something - All] < 6, "<6", [Measures].[# of Something - All]),
FORMAT_STRING = "0",
VISIBLE = 1 , ASSOCIATED_MEASURE_GROUP = 'Something';


The following picture shows the result using the actual measure from the cube and calculated measure described above side by side. You can see that this approach works very well and values in small cells do get supressed and displayed to the end user as “<6”.


Now, one can argue that this approach is too simple and it doesn’t protect suppressed values from possible re-identification if result contains only one suppressed value. Here is the scenario that describes it:
Column “Actual value” contains the original non-modified values.
Column “Suppressed value” contains suppressed values using calculated member method described in MDX above.
Column “Suppressed value with modified total” shows desired behaviour of total value when result contains only one suppressed value.

Dimension Members
Actual Value
Suppressed value
Suppressed value with modified total
Member 1
10
10
10
Member 2
5
<6
<6
Member 3
10
10
10
Grand Total*
25
25
20

At this point I was unable to find the proper solution that can be implemented within SSAS as calculated measure or perhaps SCOPE statement that would effectively overwrite the value of totals.
Solutions for a limited number of scenarios can be found in the blog maintained by Vinuthan (http://vnu10.blogspot.ca/2011/01/mdx-grand-total-sub-total.html), however he doesn’t provide a generic solution that would work for potential ways of querying the data (filters, intersection of any attributes, etc).
Please let me know if you can help in resolving this puzzle. Your help will be greatly appreciated!

Thursday, September 6, 2012

The importance of data type for averaging

Here is a small cautionary tale for those, who use Average function in SQL Server. The data type of the aggregated data element greatly influences the result of AVG aggregate function.

With source data set defined as INT, the result of the straight AVG function will produce 5. However, if we were to convert numbers to float, the result of the aggregation will become 5.5. If we than round up that number, than the result of the aggregation now becomes 6.

I guess the best practice would be to always make sure you convert source data to float before applying AVG aggregation function.

;WITH CTE AS

(
          SELECT 3 AS Rating
    UNION SELECT 4
    UNION SELECT 7
    UNION SELECT 8
)
SELECT 
AVG(Rating) as average_of_int,
AVG(cast(Rating as float)) as average_of_float, 
round(AVG(cast(Rating as float)),0) as average_of_float_rounded
FROM 
CTE

Result:
average_of_int average_of_float       average_of_float_rounded

-------------- ---------------------- ------------------------
5              5.5                    6

Wednesday, August 29, 2012

Database recovery procedure for corrupted databases

Follow the following procedure to recover corrupter SQL Server database. It is assumed that database is in full recovery mode, full database backup is available and transaction log backups was taken sometime before the failure.

If database has been corrupted due to server hardware failure and is no longer accessible through SQL Server Management Studio or SQL Analyzer, execute the following steps to recover the data.

1. Attempt to backup database transaction log so all activities that happen between last transaction log backup and point of failure can be recovered. If not successful, database can only be restored to the state when last transaction log backup was taken. Execute transaction log backup using the following statement: BACKUP LOG <database name> TO DISK = <path\filename.bak> WITH NO_TRUNCATE

2. Drop/Delete corrupted database from the server.

3. Re-Create database by restoring the last full database backup with NO RECOVERY option (use SQL Server Management Studio).

4. Sequentially restore all transaction log backups taken in the period from the last full database backup and the point of corruption. If Trans log backup attempted in step 1 was successful, restore it last and recover the database.

Quick and simple aggregation of Hierarchical Data in SQL Server


Sometimes data containing hierarchies have to be aggregated and total calculated on different levels. The following script will help archive fast calculation of totals on each level of hierarchy.


INPUT DATA STRUCTURE AND VALUES

0100***Level 1*****$21
0110*****Level 2***$6
0111******Level 3**$1
0112******Level 3**$2
0113******Level 3**$3
0120*****Level 2***$15
0121******Level 3**$4
0122******Level 3**$5
0123******Level 3**$6


-- define codes table with hierarchy

 Declare @Code Table (Code varchar(10), Hierarchy varchar(50), Description varchar(100))

 INSERT @Code (Code, Hierarchy, Description) VALUES ('0100', '1.', 'Total')
 INSERT @Code (Code, Hierarchy, Description) VALUES ('0110', '1.01.', 'Total of 0110')
 INSERT @Code (Code, Hierarchy, Description) VALUES ('0111', '1.01.01.', 'Value of 0111')
 INSERT @Code (Code, Hierarchy, Description) VALUES ('0112', '1.01.02.', 'Value of 0112')
 INSERT @Code (Code, Hierarchy, Description) VALUES ('0113', '1.01.03.', 'Value of 0113')
 INSERT @Code (Code, Hierarchy, Description) VALUES ('0120', '1.02.', 'Total of 0120')
 INSERT @Code (Code, Hierarchy, Description) VALUES ('0121', '1.02.01.', 'Value of 0121')
 INSERT @Code (Code, Hierarchy, Description) VALUES ('0122', '1.02.02.', 'Value of 0122')
 INSERT @Code (Code, Hierarchy, Description) VALUES ('0123', '1.02.03.', 'Value of 0123')

-- create table to record values for codes

 Declare @CodeValues Table (Code varchar(10), Value money)

 INSERT @CodeValues (Code, Value) VALUES ('0111', 1)
 INSERT @CodeValues (Code, Value) VALUES ('0112', 2)
 INSERT @CodeValues (Code, Value) VALUES ('0113', 3)
 INSERT @CodeValues (Code, Value) VALUES ('0121', 4)
 INSERT @CodeValues (Code, Value) VALUES ('0122', 5)
 INSERT @CodeValues (Code, Value) VALUES ('0123', 6)

-- create temp table that will combine values with code hierarcies and will be used in the rollup

 Declare @TmpValues Table (Code varchar(10), CodeHierarchy varchar(10), Value money)

 INSERT @TmpValues (Code, Value, CodeHierarchy)
 Select
   v.Code,
   v.Value,
   c.Hierarchy
 From
   @CodeValues v
   Inner Join @Code c On c.Code = v.Code

-- Rollup Data

 Select
  c.Code,
  c.Description,
  Sum(v.Value)
 From
  @TmpValues v
  Join @Code c On v.CodeHierarchy Like c.Hierarchy+'%'
 Group By
  c.Code,
  c.Description
 Order By
  c.Code

This method was originally suggested by Scot Smith, Toronto.