Friday, December 16, 2016

Converting UTC to local time

Problem

Values in the database are stored as UTC date and time in a simple datetime format. You want to see data time values in the local time.

Solution


Use the following code to convert UTC date/time to local:

CREATE TABLE #table (date_UTC datetime)

/* Populate with UTC date time */
Insert #table Select GETUTCDATE()

Select
/* UTC value */
date_UTC
/* convert UTC to local time */
,DATEADD(MILLISECOND,DATEDIFF(MILLISECOND,getutcdate(),GETDATE()),date_UTC) as date_In_LocalTime
From
table

Thursday, December 15, 2016

Use sp_replrestart to fix “The process could not execute ‘sp_repldone/sp_replcounters’” error

This error is generally raised by the log reader agent while running transactional replications. The error indicates that distributor and subscribe databases has data that may be more recent than data in the publisher database (the agent compares latest LSN in transaction logs of Publisher database and latest LSN recorded in the distributer).

This problem usually occurs after publisher database has been restored from a backup. 
To resolve the issue, run sp_replrestart stored procedure in the publisher database and then reinitialize the subscribers. Also, consider running DBCC CHECKDB on publisher database to validate consistency.

Monday, November 21, 2016

How to renew “MCSE:Business Intelligence” credentials

The other day a colleague of mine asked if I am preparing for a recertification exam for my “MCSE: Business Intelligence” certificate. His certificate was close to the expiration date and he wanted to see what resources I will be using.

That caught me by complete surprise! I totally forgot about the 3 year status of that certification. I quickly checking my profile at http://mcp.microsoft.com and there it was - my MCSE certificate was no longer active.

It turns out that Microsoft has tried to warn me, but I didn’t get those emails as they were going to an email account I don’t actively use.

At first I thought that since I missed the deadline my status has been cancelled and I would need to re-take all original exams in order to get it back. However, I decided to email Microsoft Support (certquest@microsoft.com) first and ask them about my options. Next day I received a response from them saying that my status hasn’t actually been cancelled, but was rather deactivated and that it will be re-activated as soon as I reconfirm my status by completing one of the two possible options:
  • Option 1: Take re-certification exam 470
  • Option 2: Recertify through Microsoft Virtual Academy
The second option required that I review and complete assessments for the following 9 MS Virtual Academy courses:
  1. Database Fundamentals
  2. Design and Implement Cloud Data Platform Solutions
  3. Data Storage and Processing in the Cloud Demystified
  4. Querying with Transact-SQL
  5. Faster Insights to Data with Power BI Jump Start
  6. Implementing a Data Warehouse with SQL Server Jump Start
  7. Updating Your Database Management Skills to SQL Server 2014
  8. Implementing Data Models & Reports with Microsoft SQL Server
  9. Designing BI Solutions with Microsoft SQL Server

I chose the second option because I thought it would be a great refresher and also offered convenient free online access. It took me about 1 week to watch the videos and complete quick assessment. I really enjoyed the presentation and material (yes, you can skip forward on the videos). 

Once finished I emailed my certificate of completion to certquest@microsoft.com with a request to reactivate my status which was done 2 days after.

For details on Microsoft Virtual Academy see the following link: https://www.microsoft.com/en-us/learning/recertification-virtual-academy.aspx

Wednesday, January 22, 2014

Data-Driven Subscriptions in SQL Server

I recently had a project that used data-driven subscriptions for bulk processing of SSRS reports. Subscriptions is a very powerful tool, but it lacks centralized monitoring tools, so I had to dig deep into the content database where SSRS service maintains all processing data. By default, this database is called ReportServer.

List of reports published to SSRS service is stored in Catalog table where each report is assigned an ItemID. Report can be associated with multiple subscriptions. Information about each individual subscription is stored in Subscriptions table. Here is a query that retrieves a list of reports with their corresponding subscriptions:

Select
       c.ItemID,
       c.Name,
       s.*
From
       [dbo].[Catalog] c
       Inner Join [dbo].[Subscriptions] s On s.Report_OID = c.ItemID

Subscription has many parameters defined by the user when subscription is created and stored in various text columns of Subscription table in the form of XML.

For example, ExtensionsSettings column stores information about rendering format, destination and file name settings, etc. It can be accessed by converting XML data into a record set and running XML query functions on it such as:

;WITH x AS (Select SubscriptionID, CAST(ExtensionSettings as xml) as ExtensionSettingsXML From [dbo].[Subscriptions])
Select
       s.SubscriptionID
       ,ExtensionSettingsXML
       ,ExtensionSettingsXML.v.value ('Name[1]', 'varchar(100)') as ParamValue
       ,ExtensionSettingsXML.v.value ('Field[1]', 'varchar(100)') as ParamValue
       ,ExtensionSettingsXML.v.value ('Value[1]', 'varchar(100)') as ParamValue
From
       [dbo].[Subscriptions] s
       Inner Join x On x.SubscriptionID = s.SubscriptionID
       CROSS APPLY ExtensionSettingsXML.nodes ('/ParameterValues/ParameterValue') as ExtensionSettingsXML(v)

When Subscription is initiated, it creates a record in ActiveSubscriptions table for each executing instance. Once processed, this record is removed.

Select * From [dbo].[ActiveSubscriptions]

Data-Driven Subscription works by generating a dataset (by executing a query) that provides values for report input, mapping those values to report parameters and queuing report execution. You can also use input data set attributes to specify file name for report rendering, control location where files are saved, and other parameters.
Table Events serves a role of execution queue where a record is created for each actual instance of the report with set parameters. For example, if your input data set contains 5000 records, Events table will have 5000 records one for each instance of report execution. Records are deleted from Events table as soon as report execution is complete.

Select * From [dbo].[Event]

With all that information in mind, you can create a SSRS report that queries ReportServer database and reports status of all active subscriptions. For example, you can use the following query to get this information:

Select
       s.SubscriptionID,
       'ReportName' = c.Name,
       'ReportPath' = c.Path,
       'SubscriptionDesc' = s.Description,
       'SubscriptionOwner' = us.UserName,
       'LatestStatus' = s.LastStatus,
       'LastRun' = s.LastRunTime,
       asub.ActiveID,
       asub.TotalNotifications,
       asub.TotalSuccesses,
       asub.TotalFailures,
       n.RemaininReports
From
       Subscriptions s
       join Catalog c on c.ItemID = s.Report_OID
       join ReportSchedule rs on rs.SubscriptionID = s.SubscriptionID
       join Users uc on uc.UserID = c.ModifiedByID
       join Users us on us.UserID = s.OwnerId
       Left Join ActiveSubscriptions asub On asub.SubscriptionID = s.SubscriptionID
       Left Join
              (
                     Select
                           SubscriptionID,
                           ActivationID,
                           count(*) as RemaininReports
                     From
                           Notifications n
                     Group by
                           SubscriptionID, ActivationID
              ) n On asub.ActiveID = n.ActivationID

Base on this users will be able to monitor existing subscriptions and see their last status as well as monitor active subscriptions and their progress.

Friday, March 8, 2013

Capturing user activity in the database using SQL Server Auditing functionality


SQL Server comes with a build in audit functionality that saves a lot of development effort when one of the business requirements states is to keep a record of user activity in the database.

For each query executed in the database, SQL Server Audit captures the names of the affected tables, SQL statement used for query, whether query execution was successful and whether or not user had permission to access particular table.

The deployment is very easy and straight forward. It starts from defining new SERVER AUDIT object:

USE [master]
GO
CREATE SERVER AUDIT [ServerAuditTest]
TO FILE
(      FILEPATH = N'C:\MSSQL\Data\'
,MAXSIZE = 10MB
,MAX_ROLLOVER_FILES = 10
,RESERVE_DISK_SPACE = OFF
)
WITH
 (     QUEUE_DELAY = 1000
,ON_FAILURE = CONTINUE
)

Script defines storage mode for the log data (file or application log), max size of audit files, max number of files and whether SQL should function if audit fails to start. Once created, audit object must be enabled by executing the following script:


ALTER SERVER AUDIT [ServerAuditTest]
WITH (STATE = ON);

Database audit specification object is attached to the audit object created earlier. It defines a combination of actions (events), securables (database objects) and principles (users or roles) that should be audited.

The following script defines audit for all users that belong to “DatabaseRoleWithAudit” database role executing Delete, Insert, Select, Update or Execute commands against any objects owned by dbo schema:

USE [DatabaseName]
GO

CREATE DATABASE AUDIT SPECIFICATION [DatabaseAuditTest]
FOR SERVER AUDIT [ServerAuditTest]
ADD (DELETE ON SCHEMA::[dbo] BY [DatabaseRoleWithAudit]),
       ADD (EXECUTE ON SCHEMA::[dbo] BY [DatabaseRoleWithAudit]),
       ADD (INSERT ON SCHEMA::[dbo] BY [DatabaseRoleWithAudit]),
       ADD (SELECT ON SCHEMA::[dbo] BY [DatabaseRoleWithAudit]),
       ADD (UPDATE ON SCHEMA::[dbo] BY [DatabaseRoleWithAudit])
WITH (STATE = ON)

If created with State=ON, audit starts working right away.

Querying data collected by audit is very simple. You can do it through SQL Server Management Studio by navigating to “Security \ Audit \ Audit Name”, clicking right mouse and selecting “View log” or by query audit logs in Query Analyser using the following command:

SELECT
      *
FROM
      sys.fn_get_audit_file(N'C:\MSSQL\Data\ServerAuditTest*.sqlaudit', null, null)

In the script above I defined that audit logs should be stored as rollover files, so it makes sense to add a SQL job that would query audit logs on a scheduled basis and move new records from log into a permanent table where it can be indexed for better query performance and made available to the users for analysis.

Tuesday, December 18, 2012

Vertical and horizontal lines or strips on Line Chart in SSRS


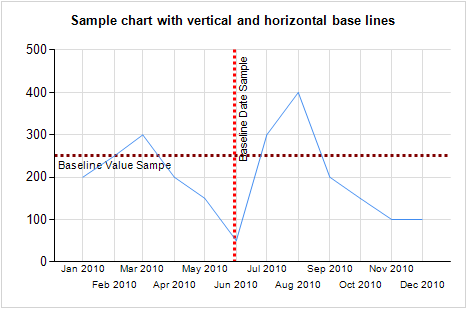
How do you show a vertical or horizontal line on a line chart in SSRS? After hours or research it seems that approach involving StripLines works the best.
Horizontal or vertical likes can be used on the chart to indicate baselines or highlight particular sections as on the sample below:


So, how do you build a chart like that? Start with the data set.
My sample dataset contains a simple query that returns: month (as date) for X axis, value for Y axis, baseline value for Y axis, baseline value for X axis (date). In order to properly plot the vertical baseline the date used as a baseline value for X axis must be converted to its integer representation. 

Here is the query:

Declare @table Table (id int identity(1,1), event_date datetime, event_value int)

Insert @table 
Select 'Jan 1, 2010', 200
Union Select 'Feb 1, 2010', 250
Union Select 'Mar 1, 2010', 300
Union Select 'Apr 1, 2010', 200
Union Select 'May 1, 2010', 150
Union Select 'Jun 1, 2010', 50
Union Select 'Jul 1, 2010', 300
Union Select 'Aug 1, 2010', 400
Union Select 'Sep 1, 2010', 200
Union Select 'Oct 1, 2010', 150
Union Select 'Nov 1, 2010', 100
Union Select 'Dec 1, 2010', 100

Declare @baseline_value int,
@baseline_date datetime

Set @baseline_value  = 250
Set @baseline_date = 'June 1, 2010'

Select 
event_date,
event_value,
@baseline_value as baseline_value,
@baseline_date as baseline_date,
CAST(@baseline_date as int) as baseline_date_int
From 
@table

The result of the query looks like this:


Create a new report and use above query as a data source. Add new Line Chart object, associate it with the data source. Select “event_value” column to be used for Values and “event_date” column will be used for Category Groups.

Modify Horizontal Axis properties as highlighted below:


Format axis label as "MMM yyyy".

Click on X axis and in the properties window find "StipLines" attribute. Click on "Collection" to open collection editor.

Modify attributes as highlighted below:


IntervalOffset value is set using formula "=CInt(Max(Fields!baseline_date_int.Value))".

Do the same steps for Y axis. IntervalOffset value is set using formula "=CInt(Max(Fields!baseline_value.Value))"

Preview the report and enjoy the result!

You can use the same technique to highlight areas on X or Y axis as below. Click here to download sample "Vertical and Horizontal Lines on line graph.rdl" for more details.


Wednesday, November 14, 2012

Scripting table data


Every now and then I need to create a SQL script to move table data between environments or to simply load table during database deployment process.

For a number of years I am using the stored procedure created by Narayana Vyas Kondreddi (http://vyaskn.tripod.com). This is a great tool for scripting data without any problems!
Attached script creates “sp_generate_inserts” stored procedure in master database (so it is accessable from any database on the server).

The description portion in the script contains the complete description of the parameters and usage examples.

You can get the script here:


This is what the output looks like:


Tuesday, October 16, 2012

Small cell value suppression in SSAS cube output


I am currently working on project building information system for one of the provincial health registries. Patient data protection and privacy is one of the main requirements that touched all parts of the information system including standard reports and SSAS cubes.

One of the requirements I’ve encountered while working with SSAS cubes was that measure values that contain values less than 6 must be suppressed and displayed to the user as “<6” in order to minimize potential patient re-identification.
My first intuition was to implement this using a calculated measure that would inspect the value of the cube measure and overwrite it with “<6” using the following statement:

CREATE MEMBER CURRENTCUBE.[Measures].[# of Something - All Supressed]
AS
iif([Measures].[# of Something - All] > 0 AND [Measures].[# of Something - All] < 6, "<6", [Measures].[# of Something - All]),
FORMAT_STRING = "0",
VISIBLE = 1 , ASSOCIATED_MEASURE_GROUP = 'Something';


The following picture shows the result using the actual measure from the cube and calculated measure described above side by side. You can see that this approach works very well and values in small cells do get supressed and displayed to the end user as “<6”.


Now, one can argue that this approach is too simple and it doesn’t protect suppressed values from possible re-identification if result contains only one suppressed value. Here is the scenario that describes it:
Column “Actual value” contains the original non-modified values.
Column “Suppressed value” contains suppressed values using calculated member method described in MDX above.
Column “Suppressed value with modified total” shows desired behaviour of total value when result contains only one suppressed value.

Dimension Members
Actual Value
Suppressed value
Suppressed value with modified total
Member 1
10
10
10
Member 2
5
<6
<6
Member 3
10
10
10
Grand Total*
25
25
20

At this point I was unable to find the proper solution that can be implemented within SSAS as calculated measure or perhaps SCOPE statement that would effectively overwrite the value of totals.
Solutions for a limited number of scenarios can be found in the blog maintained by Vinuthan (http://vnu10.blogspot.ca/2011/01/mdx-grand-total-sub-total.html), however he doesn’t provide a generic solution that would work for potential ways of querying the data (filters, intersection of any attributes, etc).
Please let me know if you can help in resolving this puzzle. Your help will be greatly appreciated!

Thursday, September 6, 2012

The importance of data type for averaging

Here is a small cautionary tale for those, who use Average function in SQL Server. The data type of the aggregated data element greatly influences the result of AVG aggregate function.

With source data set defined as INT, the result of the straight AVG function will produce 5. However, if we were to convert numbers to float, the result of the aggregation will become 5.5. If we than round up that number, than the result of the aggregation now becomes 6.

I guess the best practice would be to always make sure you convert source data to float before applying AVG aggregation function.

;WITH CTE AS

(
          SELECT 3 AS Rating
    UNION SELECT 4
    UNION SELECT 7
    UNION SELECT 8
)
SELECT 
AVG(Rating) as average_of_int,
AVG(cast(Rating as float)) as average_of_float, 
round(AVG(cast(Rating as float)),0) as average_of_float_rounded
FROM 
CTE

Result:
average_of_int average_of_float       average_of_float_rounded

-------------- ---------------------- ------------------------
5              5.5                    6

Wednesday, August 29, 2012

Database recovery procedure for corrupted databases

Follow the following procedure to recover corrupter SQL Server database. It is assumed that database is in full recovery mode, full database backup is available and transaction log backups was taken sometime before the failure.

If database has been corrupted due to server hardware failure and is no longer accessible through SQL Server Management Studio or SQL Analyzer, execute the following steps to recover the data.

1. Attempt to backup database transaction log so all activities that happen between last transaction log backup and point of failure can be recovered. If not successful, database can only be restored to the state when last transaction log backup was taken. Execute transaction log backup using the following statement: BACKUP LOG <database name> TO DISK = <path\filename.bak> WITH NO_TRUNCATE

2. Drop/Delete corrupted database from the server.

3. Re-Create database by restoring the last full database backup with NO RECOVERY option (use SQL Server Management Studio).

4. Sequentially restore all transaction log backups taken in the period from the last full database backup and the point of corruption. If Trans log backup attempted in step 1 was successful, restore it last and recover the database.

Quick and simple aggregation of Hierarchical Data in SQL Server


Sometimes data containing hierarchies have to be aggregated and total calculated on different levels. The following script will help archive fast calculation of totals on each level of hierarchy.


INPUT DATA STRUCTURE AND VALUES

0100***Level 1*****$21
0110*****Level 2***$6
0111******Level 3**$1
0112******Level 3**$2
0113******Level 3**$3
0120*****Level 2***$15
0121******Level 3**$4
0122******Level 3**$5
0123******Level 3**$6


-- define codes table with hierarchy

 Declare @Code Table (Code varchar(10), Hierarchy varchar(50), Description varchar(100))

 INSERT @Code (Code, Hierarchy, Description) VALUES ('0100', '1.', 'Total')
 INSERT @Code (Code, Hierarchy, Description) VALUES ('0110', '1.01.', 'Total of 0110')
 INSERT @Code (Code, Hierarchy, Description) VALUES ('0111', '1.01.01.', 'Value of 0111')
 INSERT @Code (Code, Hierarchy, Description) VALUES ('0112', '1.01.02.', 'Value of 0112')
 INSERT @Code (Code, Hierarchy, Description) VALUES ('0113', '1.01.03.', 'Value of 0113')
 INSERT @Code (Code, Hierarchy, Description) VALUES ('0120', '1.02.', 'Total of 0120')
 INSERT @Code (Code, Hierarchy, Description) VALUES ('0121', '1.02.01.', 'Value of 0121')
 INSERT @Code (Code, Hierarchy, Description) VALUES ('0122', '1.02.02.', 'Value of 0122')
 INSERT @Code (Code, Hierarchy, Description) VALUES ('0123', '1.02.03.', 'Value of 0123')

-- create table to record values for codes

 Declare @CodeValues Table (Code varchar(10), Value money)

 INSERT @CodeValues (Code, Value) VALUES ('0111', 1)
 INSERT @CodeValues (Code, Value) VALUES ('0112', 2)
 INSERT @CodeValues (Code, Value) VALUES ('0113', 3)
 INSERT @CodeValues (Code, Value) VALUES ('0121', 4)
 INSERT @CodeValues (Code, Value) VALUES ('0122', 5)
 INSERT @CodeValues (Code, Value) VALUES ('0123', 6)

-- create temp table that will combine values with code hierarcies and will be used in the rollup

 Declare @TmpValues Table (Code varchar(10), CodeHierarchy varchar(10), Value money)

 INSERT @TmpValues (Code, Value, CodeHierarchy)
 Select
   v.Code,
   v.Value,
   c.Hierarchy
 From
   @CodeValues v
   Inner Join @Code c On c.Code = v.Code

-- Rollup Data

 Select
  c.Code,
  c.Description,
  Sum(v.Value)
 From
  @TmpValues v
  Join @Code c On v.CodeHierarchy Like c.Hierarchy+'%'
 Group By
  c.Code,
  c.Description
 Order By
  c.Code

This method was originally suggested by Scot Smith, Toronto.

Thursday, August 11, 2011

Statistical function in T-SQL

In my current project I need to calculate mean, mode, median and percentiles (95th percentile, 99th percentile) of a given data set.

In this article I've put together a summary of what I've discovered during my research.


The following code snippets are taken from the following blog - please visit it for more detailed information:
http://blogs.lessthandot.com/index.php/DataMgmt/DataDesign/calculating-mean-median-and-mode-with-sq


MEAN Calculation

Mean is another name for average so we can use AVG function to calculate mean.

MEDIAN Calculation

Median is middle point in the set

DECLARE @Temp TABLE(Id INT IDENTITY(1,1), DATA DECIMAL(10,5))


INSERT INTO @Temp VALUES(1)
INSERT INTO @Temp VALUES(2)
INSERT INTO @Temp VALUES(5)
INSERT INTO @Temp VALUES(6)
INSERT INTO @Temp VALUES(7)
INSERT INTO @Temp VALUES(9)
INSERT INTO @Temp VALUES(10)
INSERT INTO @Temp VALUES(NULL)


SELECT ((
        SELECT TOP 1 DATA
        FROM   (
                SELECT  TOP 50 PERCENT DATA
                FROM    @Temp
                WHERE   DATA IS NOT NULL
                ORDER BY DATA
                ) AS A
        ORDER BY DATA DESC) + 
        (
        SELECT TOP 1 DATA
        FROM   (
                SELECT  TOP 50 PERCENT DATA
                FROM    @Temp
                WHERE   DATA IS NOT NULL
                ORDER BY DATA DESC
                ) AS A
        ORDER BY DATA ASC)) / 2

--MODE Calculation


DECLARE @Temp TABLE(Id INT IDENTITY(1,1), DATA DECIMAL(10,5))

INSERT INTO @Temp VALUES(1)
INSERT INTO @Temp VALUES(2)
INSERT INTO @Temp VALUES(5)
INSERT INTO @Temp VALUES(6)
INSERT INTO @Temp VALUES(7)
INSERT INTO @Temp VALUES(9)
INSERT INTO @Temp VALUES(10)
INSERT INTO @Temp VALUES(NULL)


SELECT TOP 1 WITH ties DATA
FROM   @Temp
WHERE  DATA IS Not NULL
GROUP  BY DATA
ORDER  BY COUNT(*) DESC


Percentile Calculation


Please reference the following blog for details:


http://www.sqlteam.com/article/computing-percentiles-in-sql-server


-- function for floating point division
CREATE FUNCTION dbo.FDIV 
(@numerator float, 
@denominator float)
RETURNS float
AS
BEGIN
RETURN CASE WHEN @denominator = 0.0 
THEN 0.0
ELSE @numerator / @denominator
END
END
GO

-- function for linear interpolation
CREATE FUNCTION dbo.LERP 
(@value float, -- between low and high
@low float,
@high float,
@newlow float,
@newhigh float)
RETURNS float -- between newlow and newhigh
AS
BEGIN
  RETURN CASE 
      WHEN @value between @low and @high and @newlow <= @newhigh THEN @newlow + dbo.FDIV((@value-@low), (@high-@low)) * (@newhigh - @newlow)
      WHEN @value = @low and @newlow is not NULL THEN @newlow
      WHEN @value = @high and @newhigh is not NULL THEN @newhigh
      ELSE NULL
END
END
GO


Declare @TestScores table (StudentID int, Score int)
insert @TestScores (StudentID, Score) Values (1,  20)
insert @TestScores (StudentID, Score) Values (2,  03)
insert @TestScores (StudentID, Score) Values (3,  40)
insert @TestScores (StudentID, Score) Values (4,  45)
insert @TestScores (StudentID, Score) Values (5,  50)
insert @TestScores (StudentID, Score) Values (6,  20)
insert @TestScores (StudentID, Score) Values (7,  90)
insert @TestScores (StudentID, Score) Values (8,  20)
insert @TestScores (StudentID, Score) Values (9,  11)
insert @TestScores (StudentID, Score) Values (10, 30)


--Find the percentile rank of a given score 
-- The derived table makes one scan over the data values to compute some aggregates. The outer select interpolates 
-- between the pth percentile of the nearest samples below and above the given value.
-- The result is 25, 0.5. That means a score of 25 is at the 50th percentile, the median, of the distribution.

declare @val float
set @val = 25

select 
@val as val,
dbo.LERP(@val, scoreLT, scoreGE, 
dbo.FDIV(countLT-1,countMinus1), 
dbo.FDIV(countLT,countMinus1)) as percentrank
from (
select 
SUM(CASE WHEN Score < @val 
THEN 1 ELSE 0 END) as countLT,
count(*)-1 as countMinus1,
MAX(CASE WHEN Score < @val
THEN Score END) as scoreLT,
MIN(CASE WHEN Score >= @val
THEN Score END) as scoreGE
from @TestScores
) as x1

-- Find the percentile (the score) that characterizes a given percentage

declare @pp float
set @pp = .75

select 
@pp as factor, 
dbo.LERP(max(d), 0.0, 1.0, max(a.Score), max(b.Score)) as percentile
from
(
select floor(kf) as k, kf-floor(kf) as d
from (
select 1+@pp*(count(*)-1) as kf from @TestScores
) as x1
) as x2
join @TestScores a
on 
(select count(*) from @TestScores aa
where aa.Score < a.Score) < k
join @TestScores b
on 
(select count(*) from @TestScores bb
where bb.Score < b.Score) < k+1